If you have been managing Power Platform environments for any amount of time, you probably know how this goes. A user calls you to say their app is not opening, or someone from the business tells you a critical flow has been failing since yesterday morning. You are the last one to find out.
That is exactly the problem that the Monitoring Alerts feature in the Power Platform Admin Center is designed to solve. In this post, I will walk you through what it is, how it works, when to use it, and how to configure it step by step.
Note: When writing this post, monitoring Alerts were currently a preview feature. Preview features are not meant for production use and may have restricted functionality. Check the latest state before you use it.
What Are Monitoring Alerts?
Monitoring Alerts let you define rules that track the operational health of your Power Platform resources. When a metric for a resource crosses a threshold you define, the system triggers an alert and can notify you by email.
Before we go further, it helps to understand two key terms:
- Alert rule: This is the rule you configure. You define the scope (which environments or resources to watch), the metric to monitor, the threshold, severity, and how you want to be notified.
- Triggered alert: This is what happens when one or more resources actually cross the threshold defined in your alert rule.
One important thing to understand about the evaluation cadence: alerts are evaluated every 24 hours, not in real time. All metrics in the Monitor area are 24-hour aggregates. When you create a new alert rule, the system does an on-demand evaluation immediately. After that, it runs once per day.
Prerequisites
Before you can start creating alerts, make sure the following are in place:
- You must be a Tenant administrator or an Environment administrator.
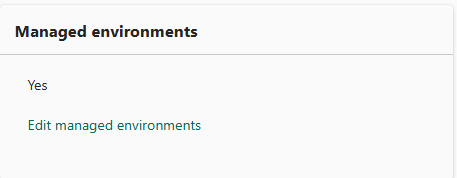
- The environment must be a Managed Environment. Regular environments are not supported.
- You need access to the new Power Platform Admin Center.
If your environment is not yet a Managed Environment, alerts will not be available for it. Keep that in mind when planning your monitoring strategy.
Two Ways Alerts Work: Custom vs. Predefined
There are two types of alerts in the platform: custom alert rules that you create yourself, and predefined alerts that Microsoft provides out of the box.
Custom Alert Rules
Custom alerts are the ones you configure. You decide what to watch, what threshold matters for your organization, who gets notified, and how severe the alert is. Custom alerts can be scoped to an entire environment or to a specific individual resource.
Custom alerts support the following products:
- Power Apps (Canvas apps, Model-driven apps)
- Power Automate (Cloud flows, Desktop flows)
- Copilot Studio (Agents)
Predefined Alerts from Microsoft
Predefined alerts come out of the box and require no setup. Microsoft creates and manages them. They are turned on by default and have a tenant-wide scope, meaning they watch all resources of a certain type across your entire tenant.
The predefined alerts cover these scenarios:
“High-use” has a specific meaning here. The system only flags resources that meet minimum usage thresholds so that you are not flooded with noise:
| Product | High-Use Threshold |
|---|---|
| Canvas apps | 100 or more app launches recently |
| Model-driven apps | 100 or more app launches recently |
| Cloud flows | 150 or more daily runs |
| Desktop flows | 100 or more daily runs |
| Agents | 200 or more recent sessions |
You cannot change these thresholds. Also, predefined alerts do not send email notifications. You need to check the Monitor area manually or set up your own custom alerts to get email notifications.
Use Case Scenarios
Let me walk through a few real-world scenarios where alerts genuinely help.
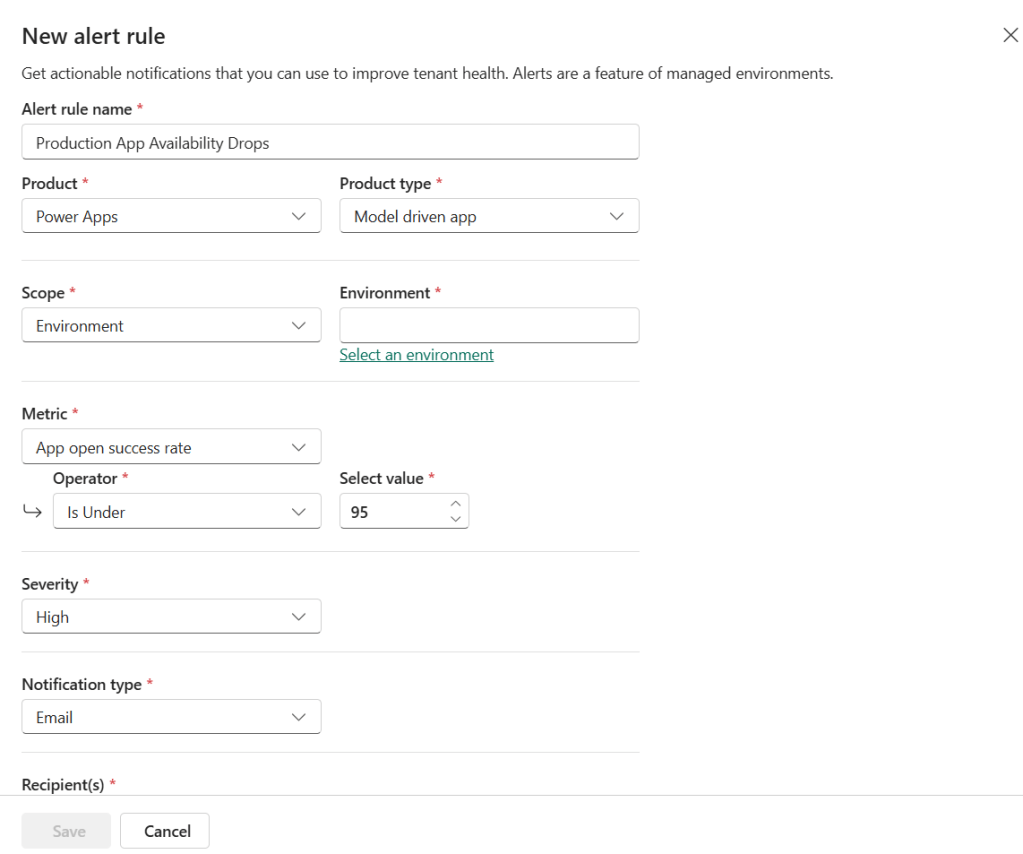
Scenario 1: Production App Availability Drops
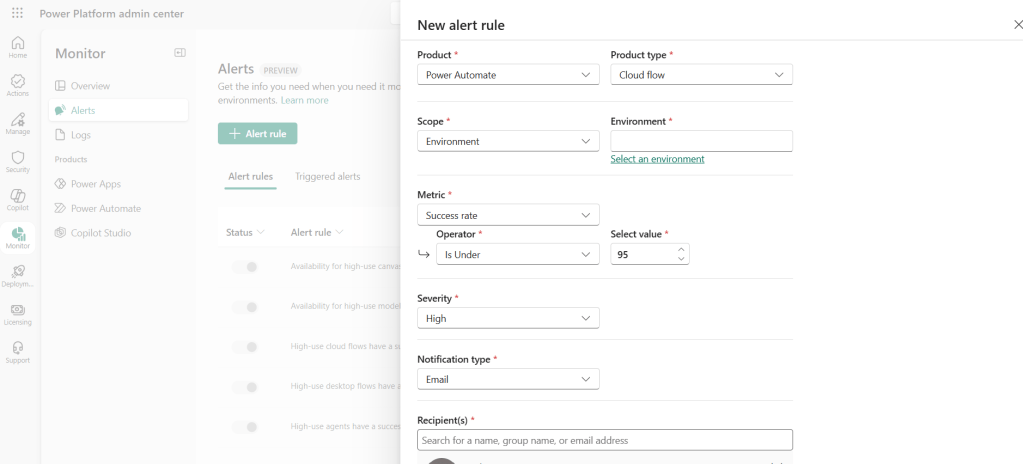
You have a model-driven app in your production environment that your sales team uses every day. You want to know immediately if its availability drops below 95%. You create a custom alert scoped to that specific app, set the metric to availability, the operator to “Is Under”, and the threshold to 95. You set severity to High and add email notifications for you and your team lead.
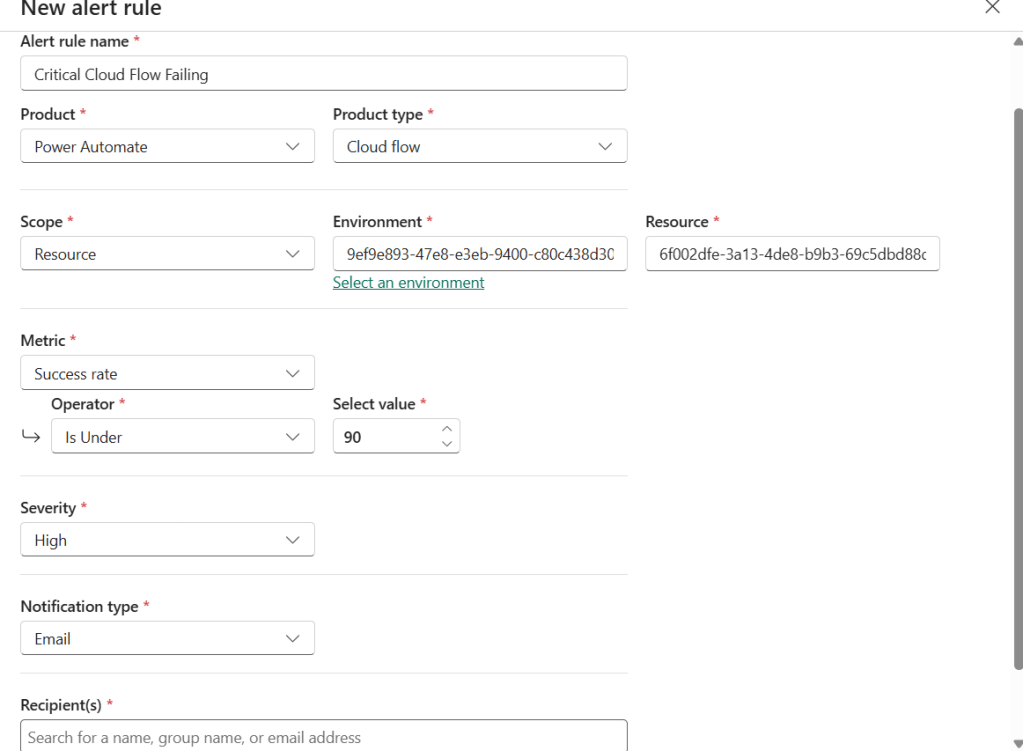
Scenario 2: Critical Cloud Flow Failing
A cloud flow handles new customer onboarding. If it starts failing, the business impact is significant. You set up a custom alert on that specific flow for success rate under 90%, with High severity and email notifications.
Scenario 3: Proactive Monitoring After a Predefined Alert Triggers
You check the Monitor Overview page and notice a predefined alert fired for a high-use canvas app with availability under 90%. You do not have a custom alert on that app yet. This is a good signal to create one with your own thresholds and email notifications so you get proactively informed from now on.
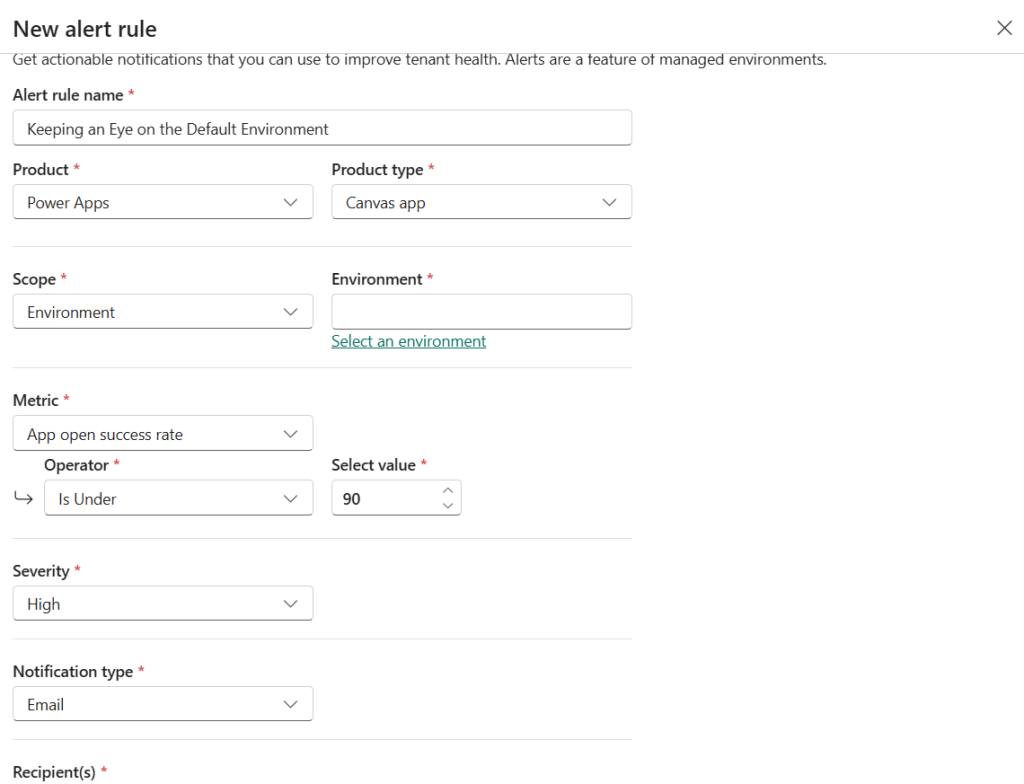
Scenario 4: Keeping an Eye on the Default Environment
Your organization’s default environment is a Managed Environment and users are building and running apps there without much governance. You create an environment-scoped alert to catch any canvas app with availability dropping below 90%, to stay aware of what is happening there.
Step-by-Step: Create an Alert on an Environment
This option watches all resources of a certain type within an environment. Here is how to set it up.
- Sign in to the Power Platform Admin Center.
- In the left navigation pane, select Monitor.
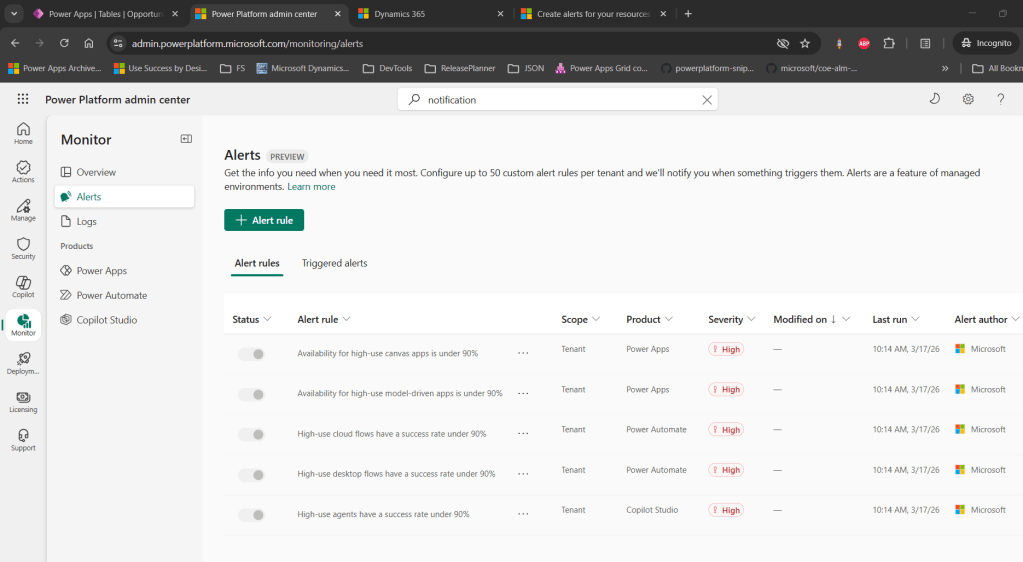
- Under Monitor, select Alerts. The Alert rules tab is displayed.
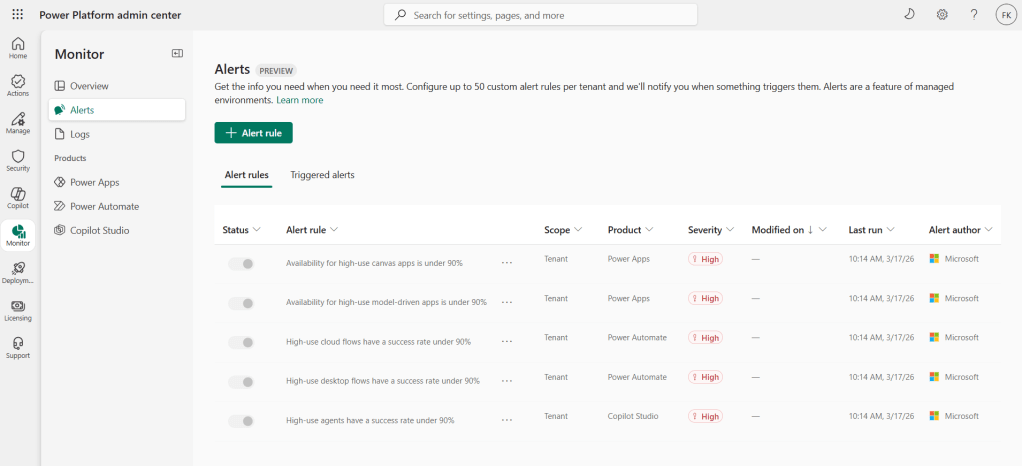
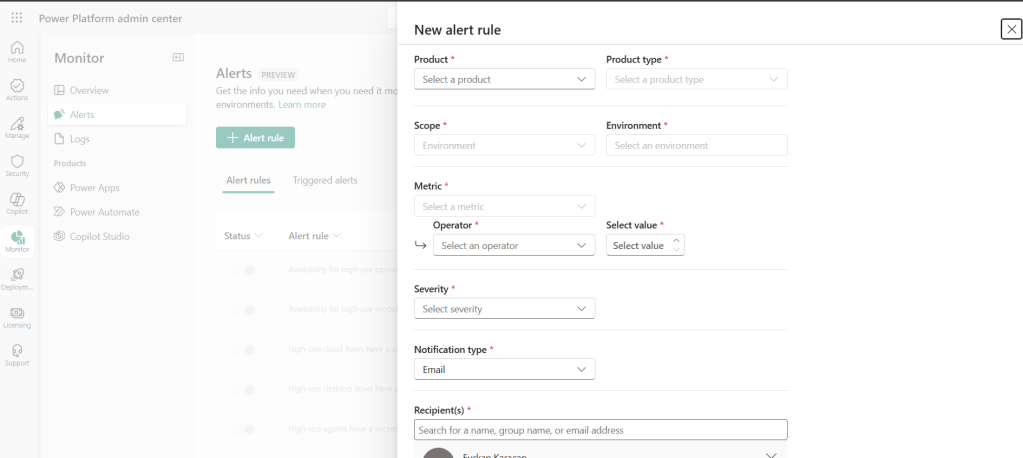
- Select + Alert rule to open the New alert rule pane.
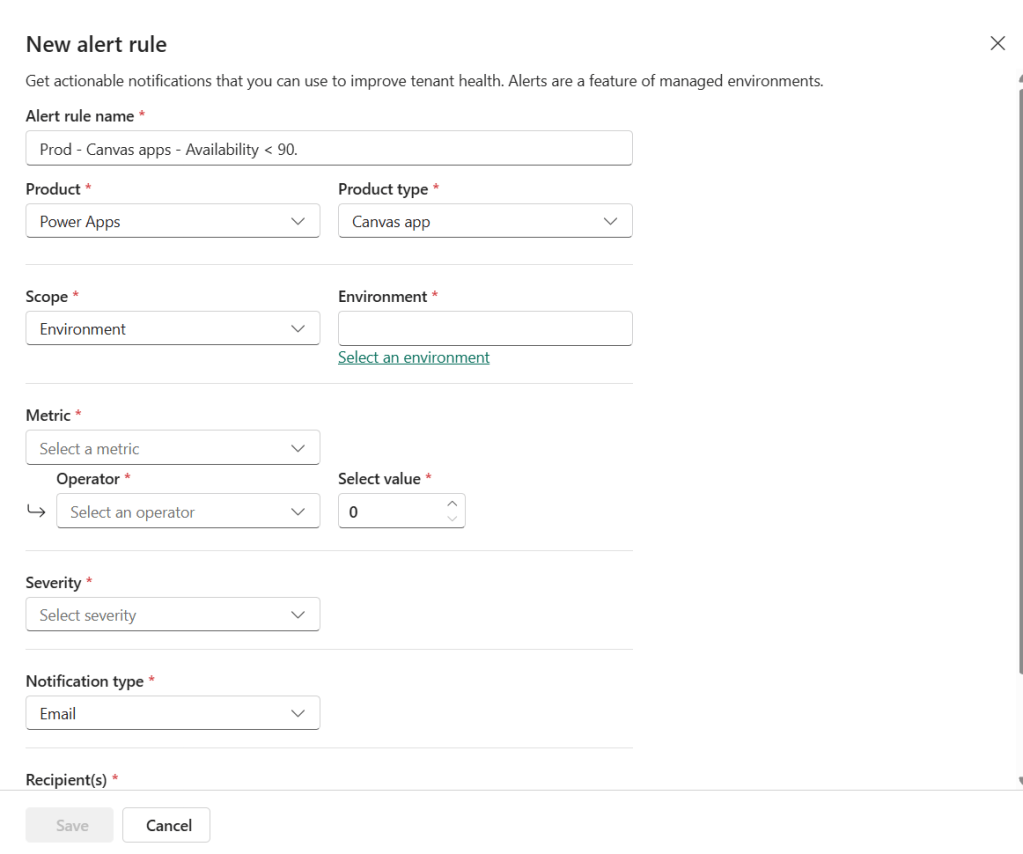
- In the Alert rule name field, enter a descriptive name. I recommend a naming convention like
Prod - Canvas apps - Availability < 90. - In the Product list, select the product you want to monitor: Power Apps, Power Automate, or Copilot Studio.
- In the Product type list, select the specific type, such as Canvas app or Cloud flow.
- In the Scope list, select Environment, then select the specific environment you want to monitor.
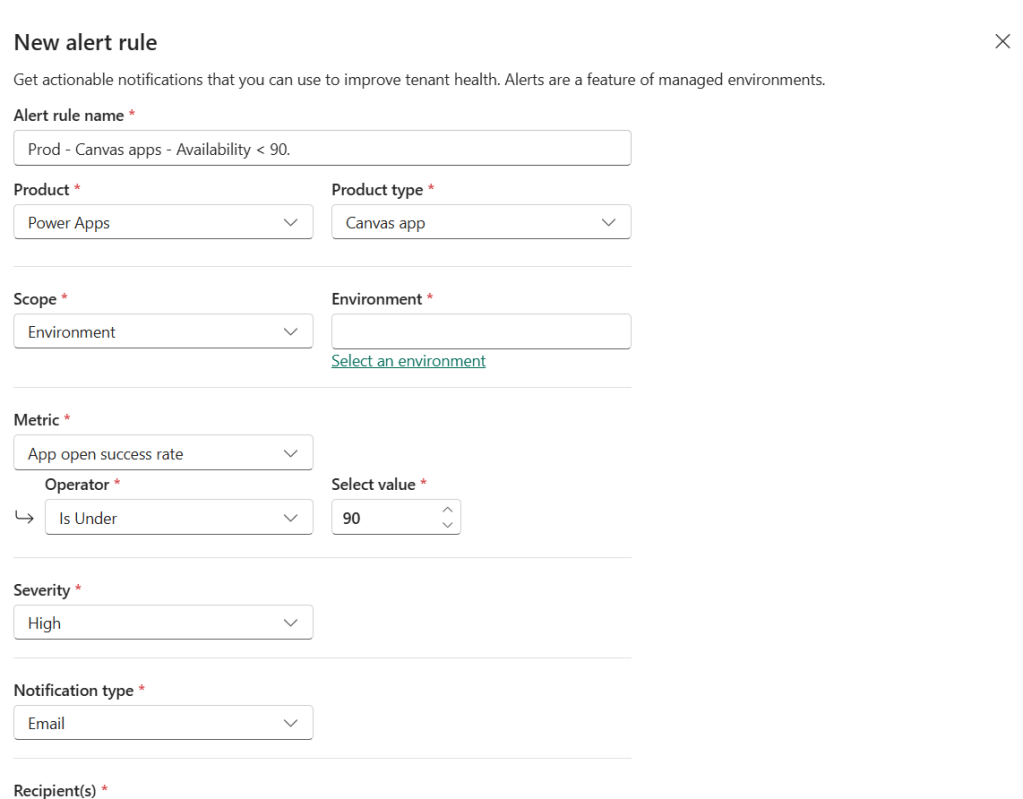
- In the Metric list, select the metric to monitor, such as App open success rate.
- In the Operator list, select Is Under, Is Over, or Equals.
- In the Select value field, set your threshold number using the arrow icons.
- In the Severity list, select Low, Medium, or High. This is a triage label and does not affect how often the rule evaluates.
- In the Notification type list, choose your preference:
- None – No email. You check the admin center manually.
- Email – You and up to four other recipients get an email when the alert triggers. Emails come from
PowerPlat-noreply@microsoft.com.
- If you selected Email, add recipients in the Recipient(s) field.
- Select Save.
urce you want to watch.
The Monitor Overview Page
Once you have alerts set up, the Monitor Overview page becomes your daily dashboard. It shows two summary cards side by side.
The Triggered custom alerts card shows the state of your triggered custom alert rules, broken down by severity. The Top priorities section highlights which alerts triggered most recently. Selecting one of those alerts shows you which resources triggered it.
The Triggered alerts for high-use items card shows which predefined alerts from Microsoft triggered. It breaks them down by product type. Selecting a predefined alert shows all the resources across your tenant that triggered it, regardless of whether they are in a Managed Environment or not.
Selecting a specific resource in either view opens a pane with time-series metric data and, for Managed Environments, recommendations for how to improve the metric.
When an Alert Triggers
If you configured email notifications on a custom alert rule, you will receive an email from PowerPlat-noreply@microsoft.com when the alert triggers.
The email includes a Go to Alert button that takes you directly to the triggered alert in the admin center. From there, you can see which resources triggered the rule and review the time-series metric data for each one.
Remember that predefined alerts do not send email notifications. For those, you need to check the Monitor Overview page manually.
Managing Your Alert Rules
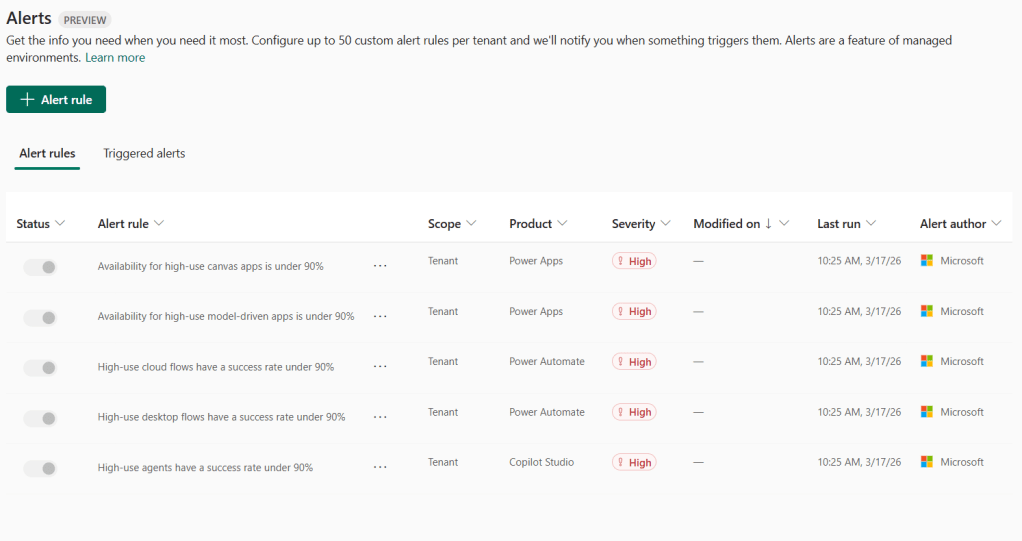
To manage existing rules, go to Monitor > Alerts and use the Alert rules tab.
From there you can:
- Edit or delete existing rules using the three-dot menu next to each rule.
- Turn a rule on or off using the toggle in the Status column.
- Check the Last Run column to see when each rule last evaluated.
Keep in mind that a tenant can have a maximum of 50 alert rules turned on at the same time. You can create unlimited rules, but only 50 can be active. If you hit that limit, turn off or delete rules you no longer need.
Best Practices
Here are a few recommendations based on working with this feature:
- Start small. Create rules for your most critical production resources first. App availability, flow success rates, and app open times are good starting points.
- Name consistently. A pattern like
Prod - Canvas apps - Availability < 90makes it easy to manage your rules as they grow. - Use severity intentionally. Set High for production-impacting metrics. Use Medium or Low for trend monitoring in lower environments.
- Validate email routing. Make sure your recipients can receive email from
PowerPlat-noreply@microsoft.com. Check spam filters and your organization’s mail flow rules before relying on email alerts in production. - Use predefined alerts as a starting point. If a predefined alert fires for a resource, that is your signal to create a custom alert on that resource with your own thresholds and email notifications.
- Factor in the 24-hour cadence. Alerts are not real-time. A resource could have been degraded for hours before you are notified. Keep that in mind when defining your incident response process.
Wrapping Up
Monitoring Alerts in the Power Platform Admin Center is a straightforward but genuinely useful feature for any team managing Power Platform at scale. It helps you shift from reactive to proactive, which makes a real difference when production issues come up.
Start with a few high-priority rules for your most critical apps and flows. Use the predefined alerts as a guide to discover which resources deserve closer attention, then build out your custom alert coverage from there.
If you have questions or want to share how you are using alerts in your organization, drop a comment below. I would love to hear from you.
Thanks for reading!

Leave a comment