In this blog post i am going to talk about how to create a machine learning model on Azure Machine Learning Studio. I am going to discuss about preparing datasets, data cleaning, feature selection, picking right machine learning model and evaluating a model score. Every resource in this article is open source and easy to reach.
Before we start we need some prerequisites
- Basic machine learning knowledge.
- An azure account. You can get it from here for free.
- We will use famous titanic dataset. You can download from here. Just download the train.csv and test.csv under the Data Source.
After you set everything let’s sign in our studio on portal.azure.com. The first step will be the upload datasets to the Azure ML Studio.
Uploading Dataset to the Azure ML Studio
When you sign in to the studio you will see tabs on the left screen and “+New” button on the bottom of the screen. To upload your datasets to the studio click “+New” button. Upload both test and train datasets you downloaded.
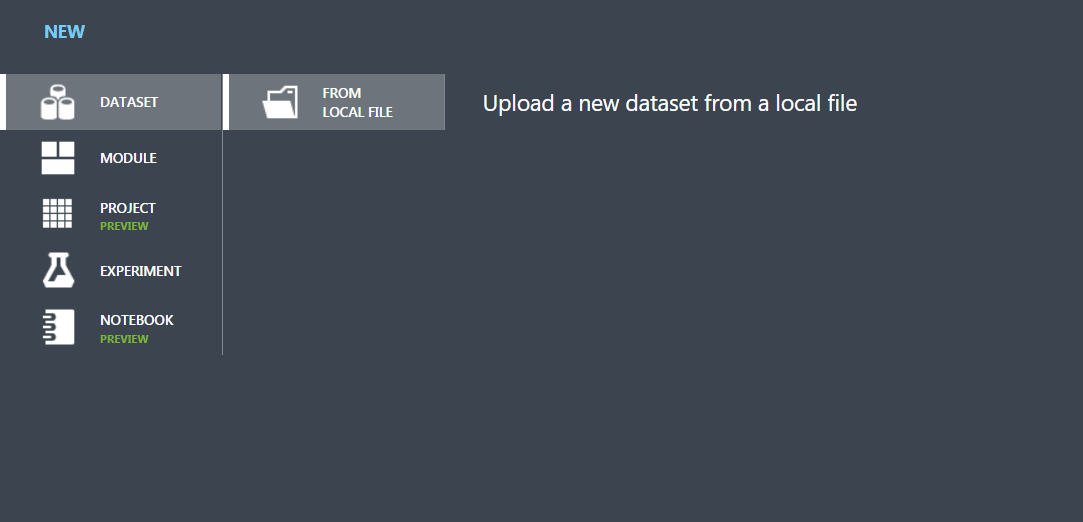
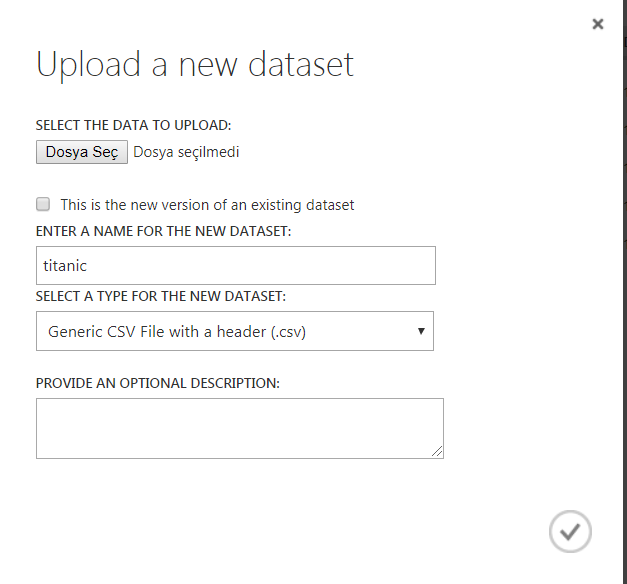
On the Datasets tab select “FROM LOCAL FILE” and choose your downloaded titanic datasets. Enter a name for it. For the type of dataset, select the Generic CSV file with the header. Click okay.
It may take a minute to upload, depending on your connection speed. Once it uploaded, click again to the “+New” button and this time select “Experiment”,
then select Blank Experiment

Let’s Look at Our Dataset
You will see on the left our Machine Learning items.You can expand and look into the categories. I am not going to use most of them for now but you can examine them if you are curious.

Now, first thing first let’s give a name to our experiement and put the train.csv dataset into the experiement.
Under the Saved Datasets, select your dataset and drag into the screen.

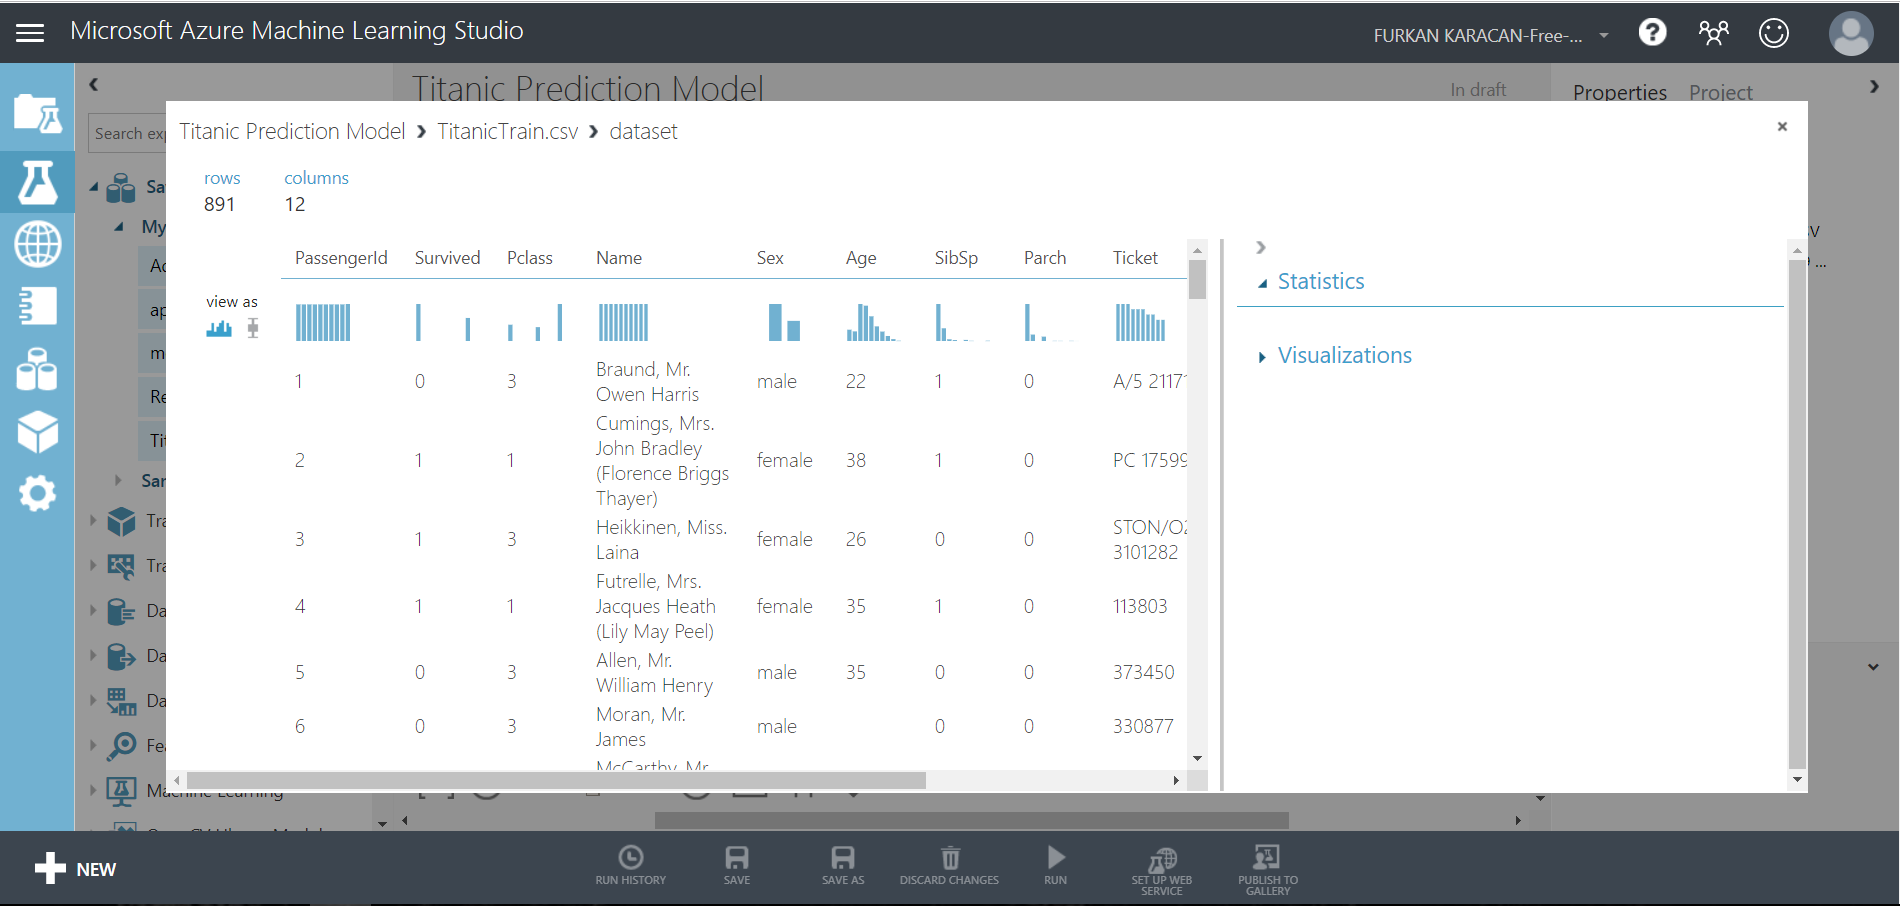
After you drop the dataset, right click into it and select dataset->Visualize.
| Variable | Definition | Key |
| Survived | Survived or Not | 0 = No, 1 = Yes |
| PassengerId | Id of the passenger | |
| pclass | Class of Travel | 1 = 1st, 2 = 2nd, 3 = 3rd |
| sex | Gender | |
| Name | Name of Passenger | |
| Age | Age of Passengers | |
| sibsp | Number of Sibling/Spouse aboard | |
| parch | Number of Parent/Child aboard | |
| ticket | Ticket Id | |
| fare | Fare | |
| embarked | The port in which a passenger has embarked. | C – Cherbourg, S – Southampton, Q = Queenstown |
| cabin | Cabin |
It is important to categorized our dataset accurately. Let’s look at the deeper meanings of some columns:
parch: The dataset defines family relations in this way…
Parent = mother, father
Child = daughter, son, stepdaughter, stepson
Some children travelled only with a nanny, therefore parch=0 for them.
sibsp: The dataset defines family relations in this way…
Sibling = brother, sister, stepbrother, stepsister
Spouse = husband, wife (mistresses and fiancés were ignored)
pclass: A proxy for socio-economic status (SES)
1st = Upper
2nd = Middle
3rd = Lower
Now we can start to exploration our dataset and do some feature selection process.
Exploration and Future Selection
If you look at dataset column by column, it is safe to say in first sight the Ticket and PassengerId columns don’t make sense for the model and they make noises.
If you look at Cabin column you will see there is 687 missing values. There are a number of different ways we could go about doing this. Given the small size of the dataset, we probably should not opt for deleting either entire observations (rows) or variables (columns) containing missing values. There is the option of either replacing missing values with a sensible values given the distribution of the data, e.g., the mean, median or mode. Finally, we could go with prediction. You can go with what you desire, Since my goal is the show the Studio, i am going to delete the cabin row.
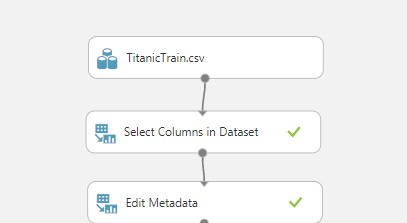
To exclude columns from our dataset, write search field “Select Columns in Dataset” and drop into model.
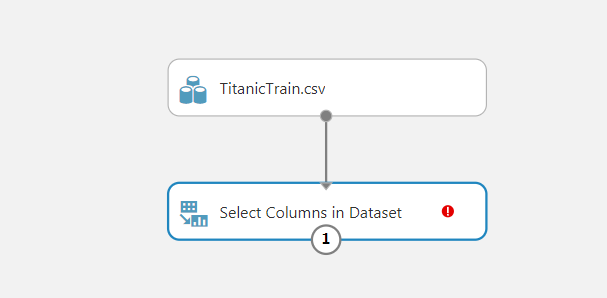
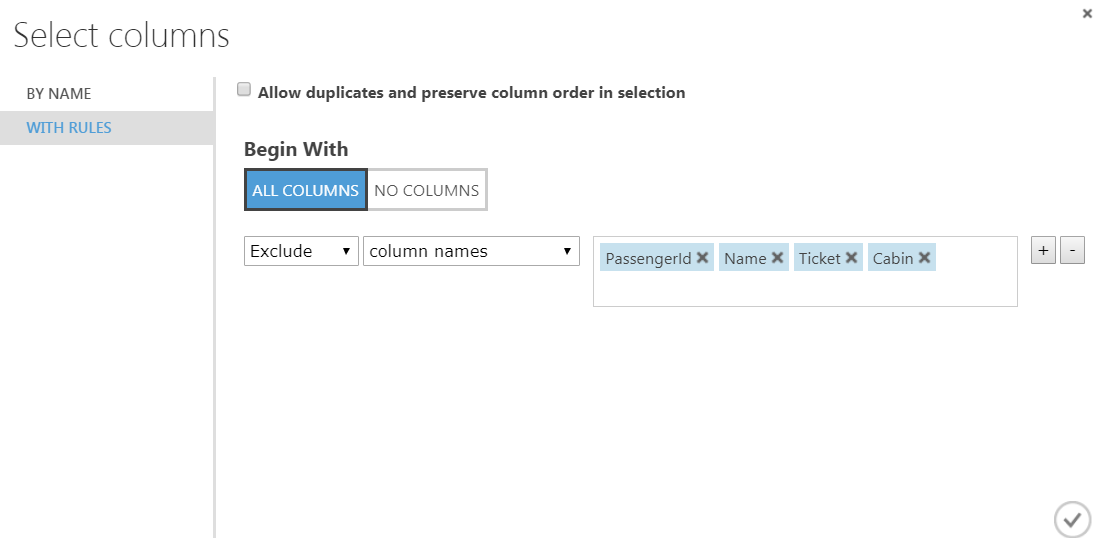
Click on the Select Columns in Dataset and on the right of the screen click the column selector. Under the With Rules tab exclude columns as follow.
Next, we need to categorize the columns. Because string columns for example “Male” or “Female” means nothing for the model but if we categorize it, it will process the data properly. The model can’t know what is 0 and 1’s in Survived columns stand for. They are currently integer. When we categorize it, it stands meaningful values for the model.
Write “Edit Metada” to the search bar and drop into the model and link with “Select Columns in Dataset”. If you don’t see the green tick in your model it means you are not run your experiement yet. It is not important.
Click “Edit Metada” and on the right screen under Properties:
- Under Data type select Unchanged
- Under Categorical select Make categorical
- Remain Fields unchanged
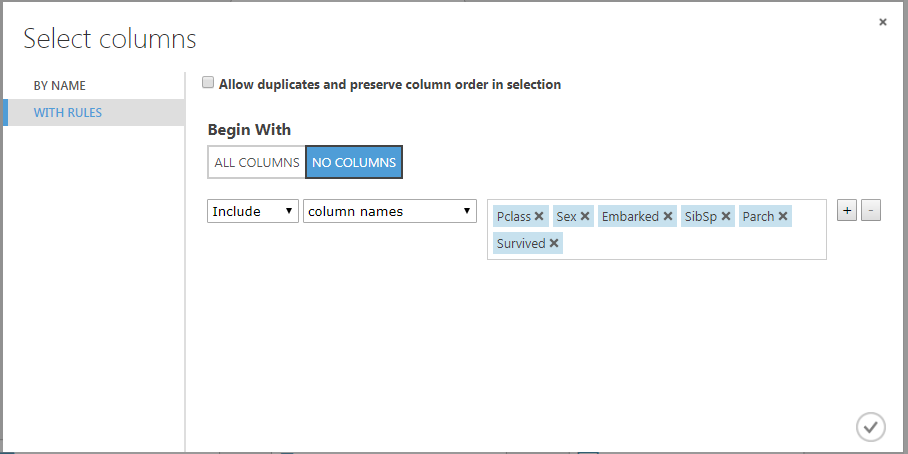
Then click Launch column selector and select Pclass, Sex, Embarked, SibSp, Parch, Survived. It is important to you understand why we choose these columns. So make sure you investigate these columns and understand why.
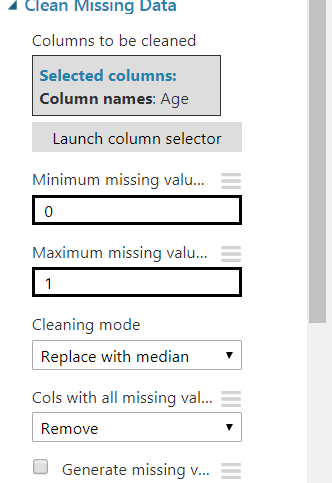
Now if you look at Age column, there is many missing values, since Age is important for our experiement, i want to keep this column and replace its missing values with median. It is pretty easy with “Clean Missing Data” item.
Search “Clean Missing Data” and drop into experiement. Link with previous step and click on it. On the Properties tab select only Age column and under the cleaning Mode select “Replace with median”.
Now run the experiement and right click to Clean Missing Data step and select Cleaned Dataset -> Visualize.
İf you look at Embarked column, there is only 2 missing values, so it is safe to remove these rows.
Drag again another “Clean Missing Data” step. This time select the Embarked column and under the Cleaning mode select “Remove entire row”.
Now we can consider our dataset is clean to train. Of course you can still improve the dataset if you want. In fact, work on a little bit and try to make the dateset cleaner.
Training
We made the data cleaning and the future selection. Now we can move on to the training our models. Since our outcome will be binary, i will use the 2 different regression models and compare their scores with each other.To get higher training score i will crosscheck their score to evaluate the model.
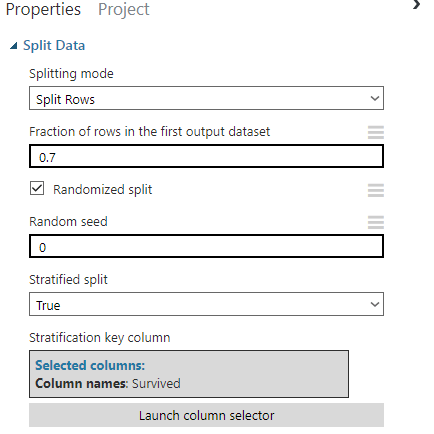
I will starting with splitting the dataset into the test and train sets. Search the “Split Data” and drag it into the flow. Under the “Split Data” properties select the properties as you wish. I will use Stratified split.
Becausethe stratified sampling divides the population into separate groups, called strata. Then, a probability sample is drawn from each group.
Stratified sampling has several advantages over simple random sampling. For example, using stratified sampling, it may be possible to reduce the sample size required to achieve a given precision. Or it may be possible to increase the precision with the same sample size.
Since our result will be binary i will go with the “Two-Class Logistic Regression” and “Two-Class Decision Forest” models. But there is many other machine learning models. Feel free to try different models.
You can find them from the search bar or under the Machine Learning tab. Also we need the “Train Model” and “Score Model” items for each model. Drag all items to the flow and connect them with the “Split Data” item. The left node of the “Split Data” is the data splitted by the proportion you entered. In my case it is 0,7. The right node is the test data which is the 0,3 of the dataset.

Connect the models and the data as above. Then connect the “Score Model” items with the “Train Model” items. Finally drag a “Evaluate Model” item to the flow and run the flow. After it is completed, right click to the evaluate model and select Evaluation Model -> Visualize. You will see the 2 different models comparing.

At next post, i am going to demonstrate how to expose this model as web service and how to consume this service via ASP.NET Core MVC app with a nice website.

Leave a comment